
Sales Analytics & KPI Metrics
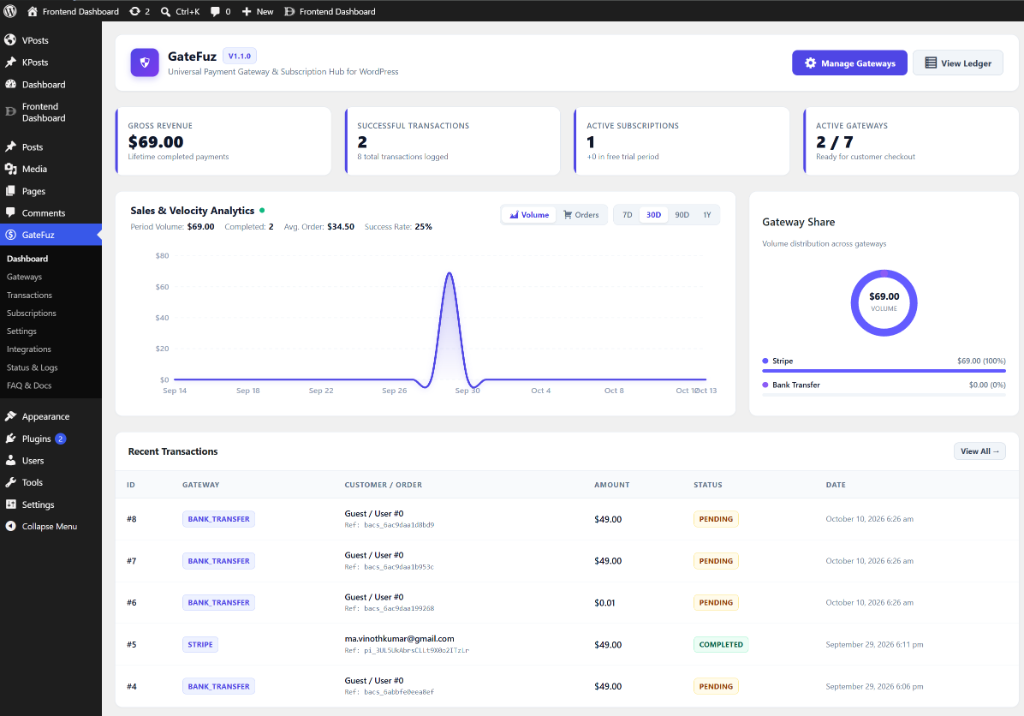
Navigate to GateFuz → Dashboard to view your real-time store performance hub.
Key Performance Indicators (KPIs)
Section titled “Key Performance Indicators (KPIs)”- Gross Volume: Total verified completed revenue across all gateways in the selected period.
- Completed Orders: Total count of orders with status
completed. - Average Order Value (AOV): Total volume divided by completed order count.
- Conversion Success Rate: Percentage of initiated transactions that reached completion.
Interactive Sales Velocity Chart
Section titled “Interactive Sales Velocity Chart”- Cubic Bézier Curve: Renders smooth SVG sales trends over time.
- Metric Toggle: Switch dynamically between Gross Volume ($) and Order Count.
- Date Filters: Switch between 7 Days (7D), 30 Days (30D), 90 Days (90D), and 1 Year (1Y).
- Hover Crosshair: Live hover tooltips tracking date, volume, and order breakdown.
Gateway Volume Distribution
Section titled “Gateway Volume Distribution”An interactive SVG donut meter displaying volume distribution across Stripe, PayPal, Razorpay, Mollie, Paystack, and Bank Transfer, complete with percentage share and progress indicators.